NebulaCloud Studio · GIS Data Visualization

India Census 2011
District-Level Thematic Maps

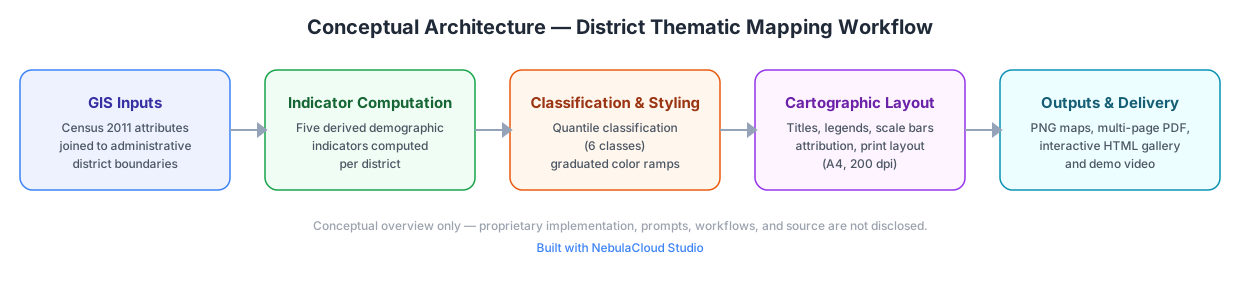
Five professional choropleth maps — literacy, sex ratio, Scheduled Caste, Scheduled Tribe, and workforce participation — computed for 642 districts and rendered with quantile (6-class) classification.

Download combined report (5 pages) Watch demo video View architecture
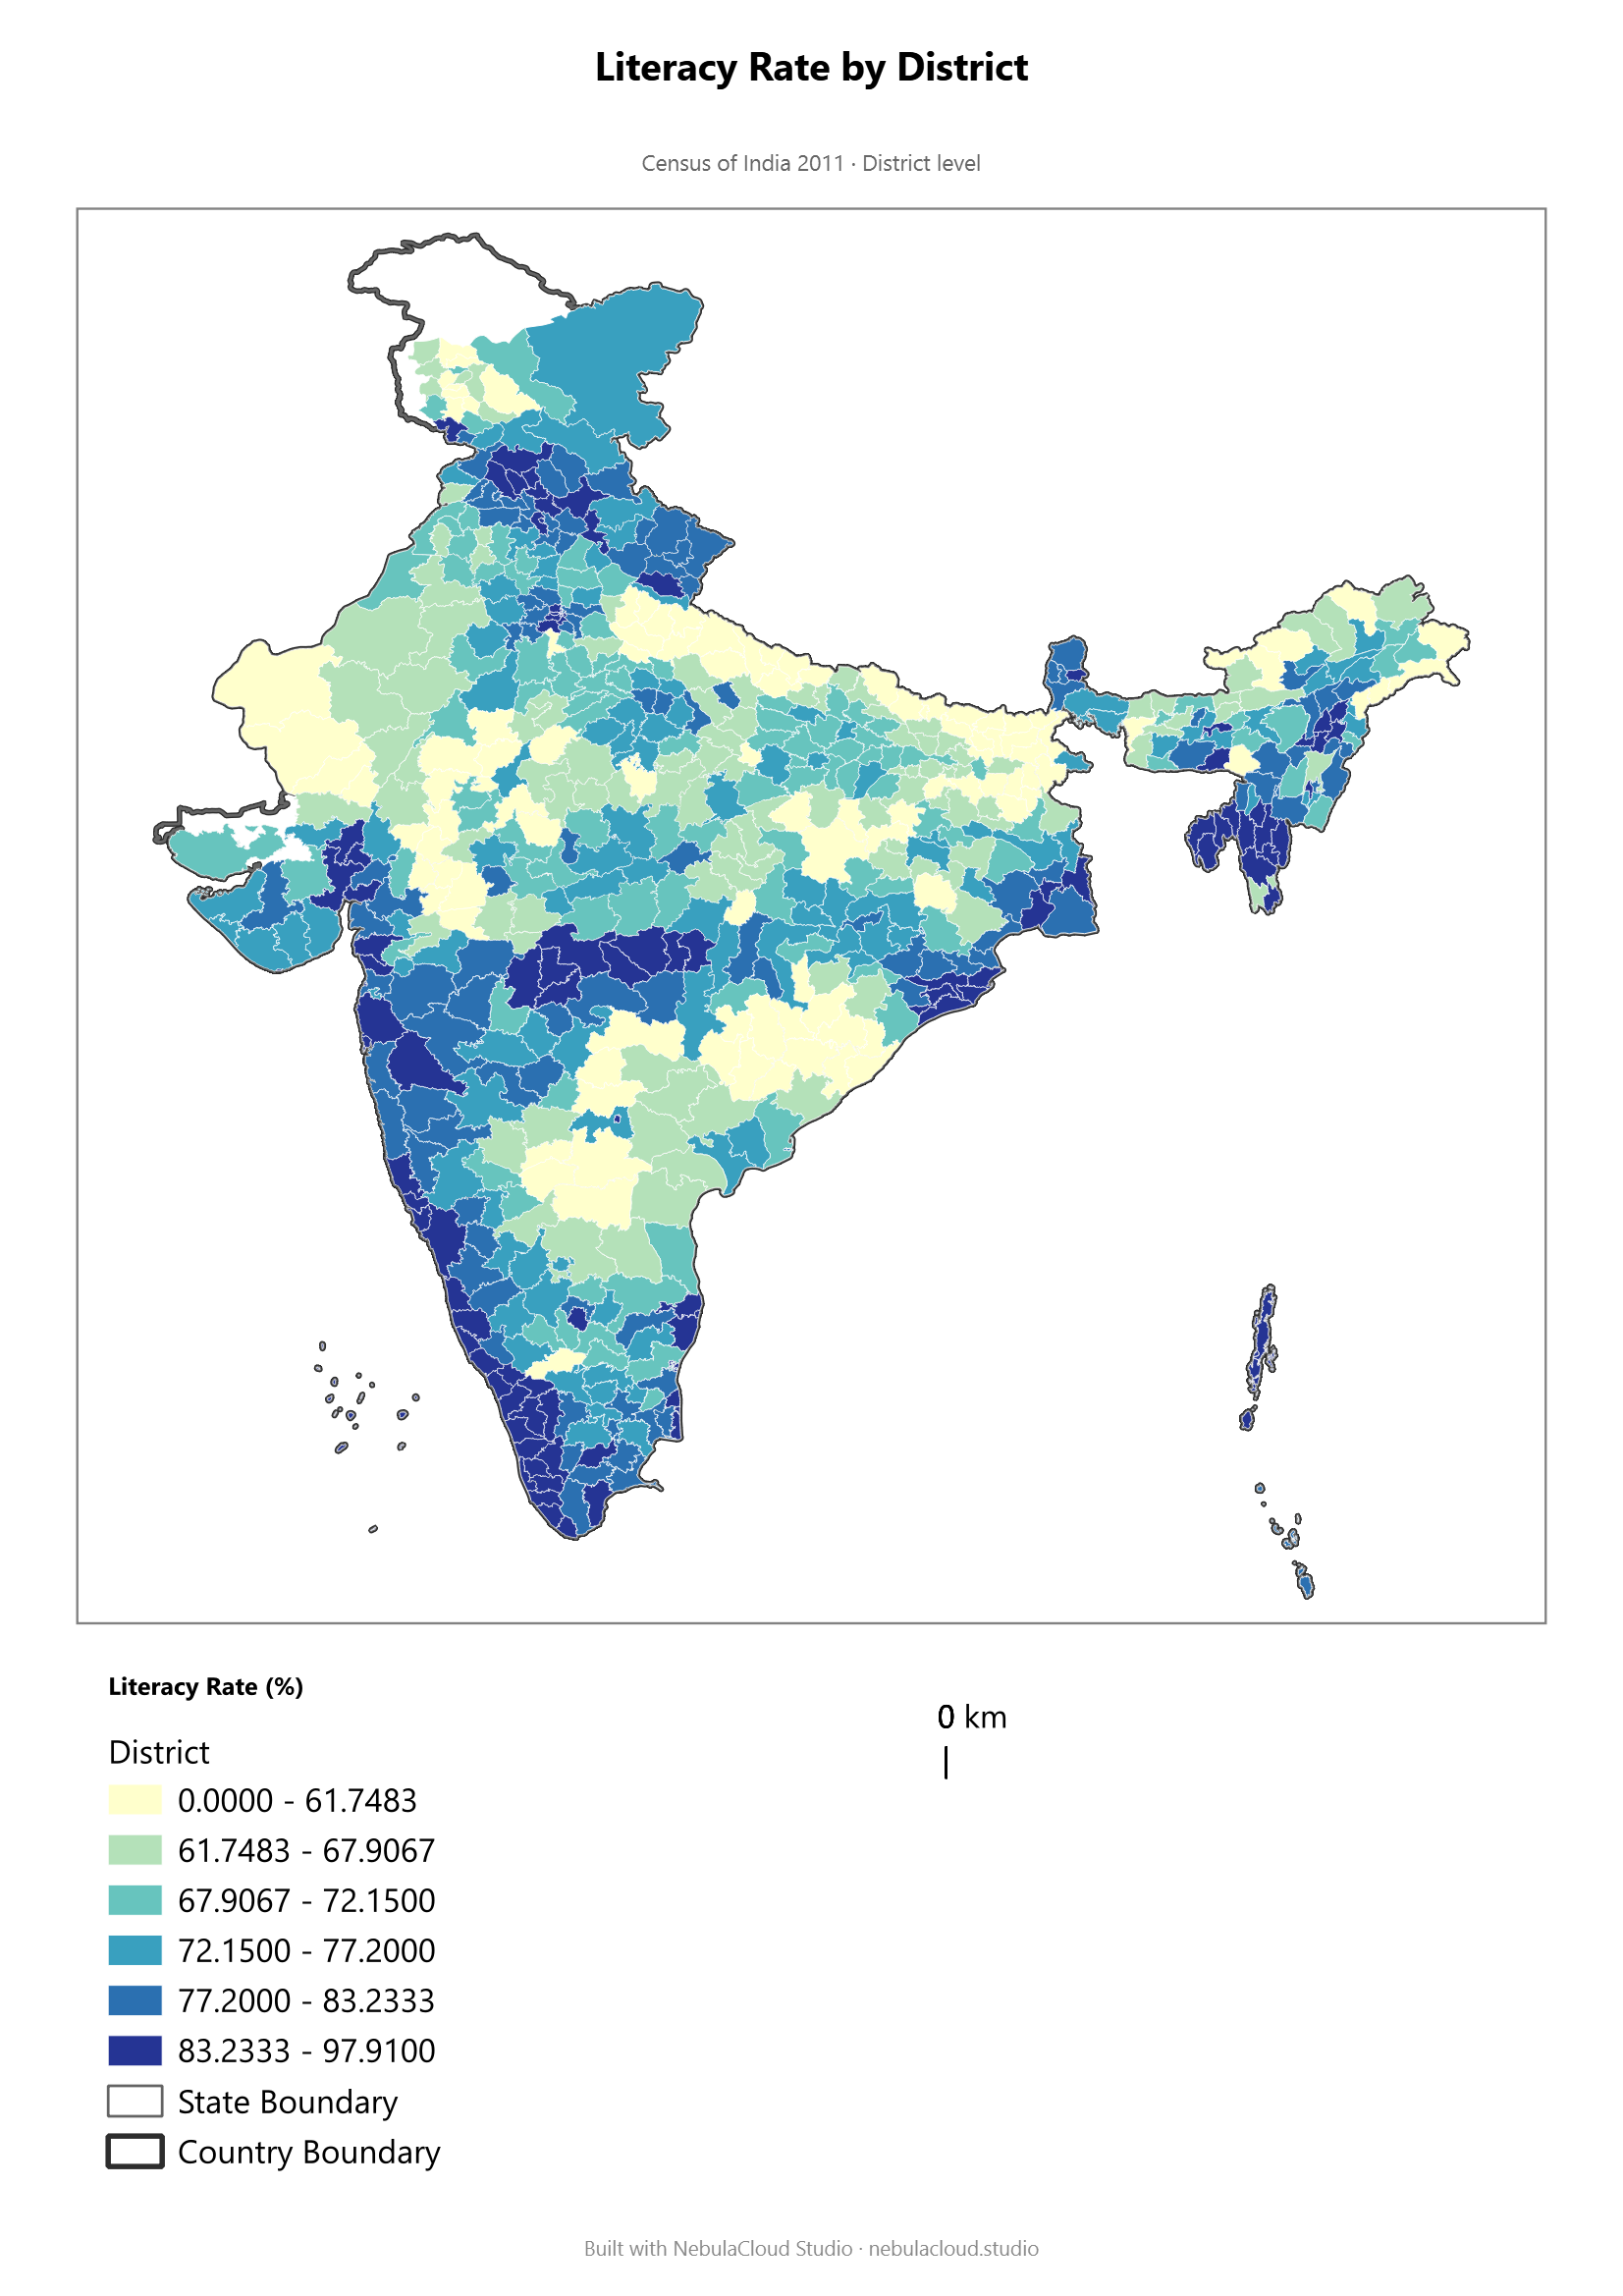
Literacy Rate by District

Literacy Rate

Literate share of the population aged 7 and above.
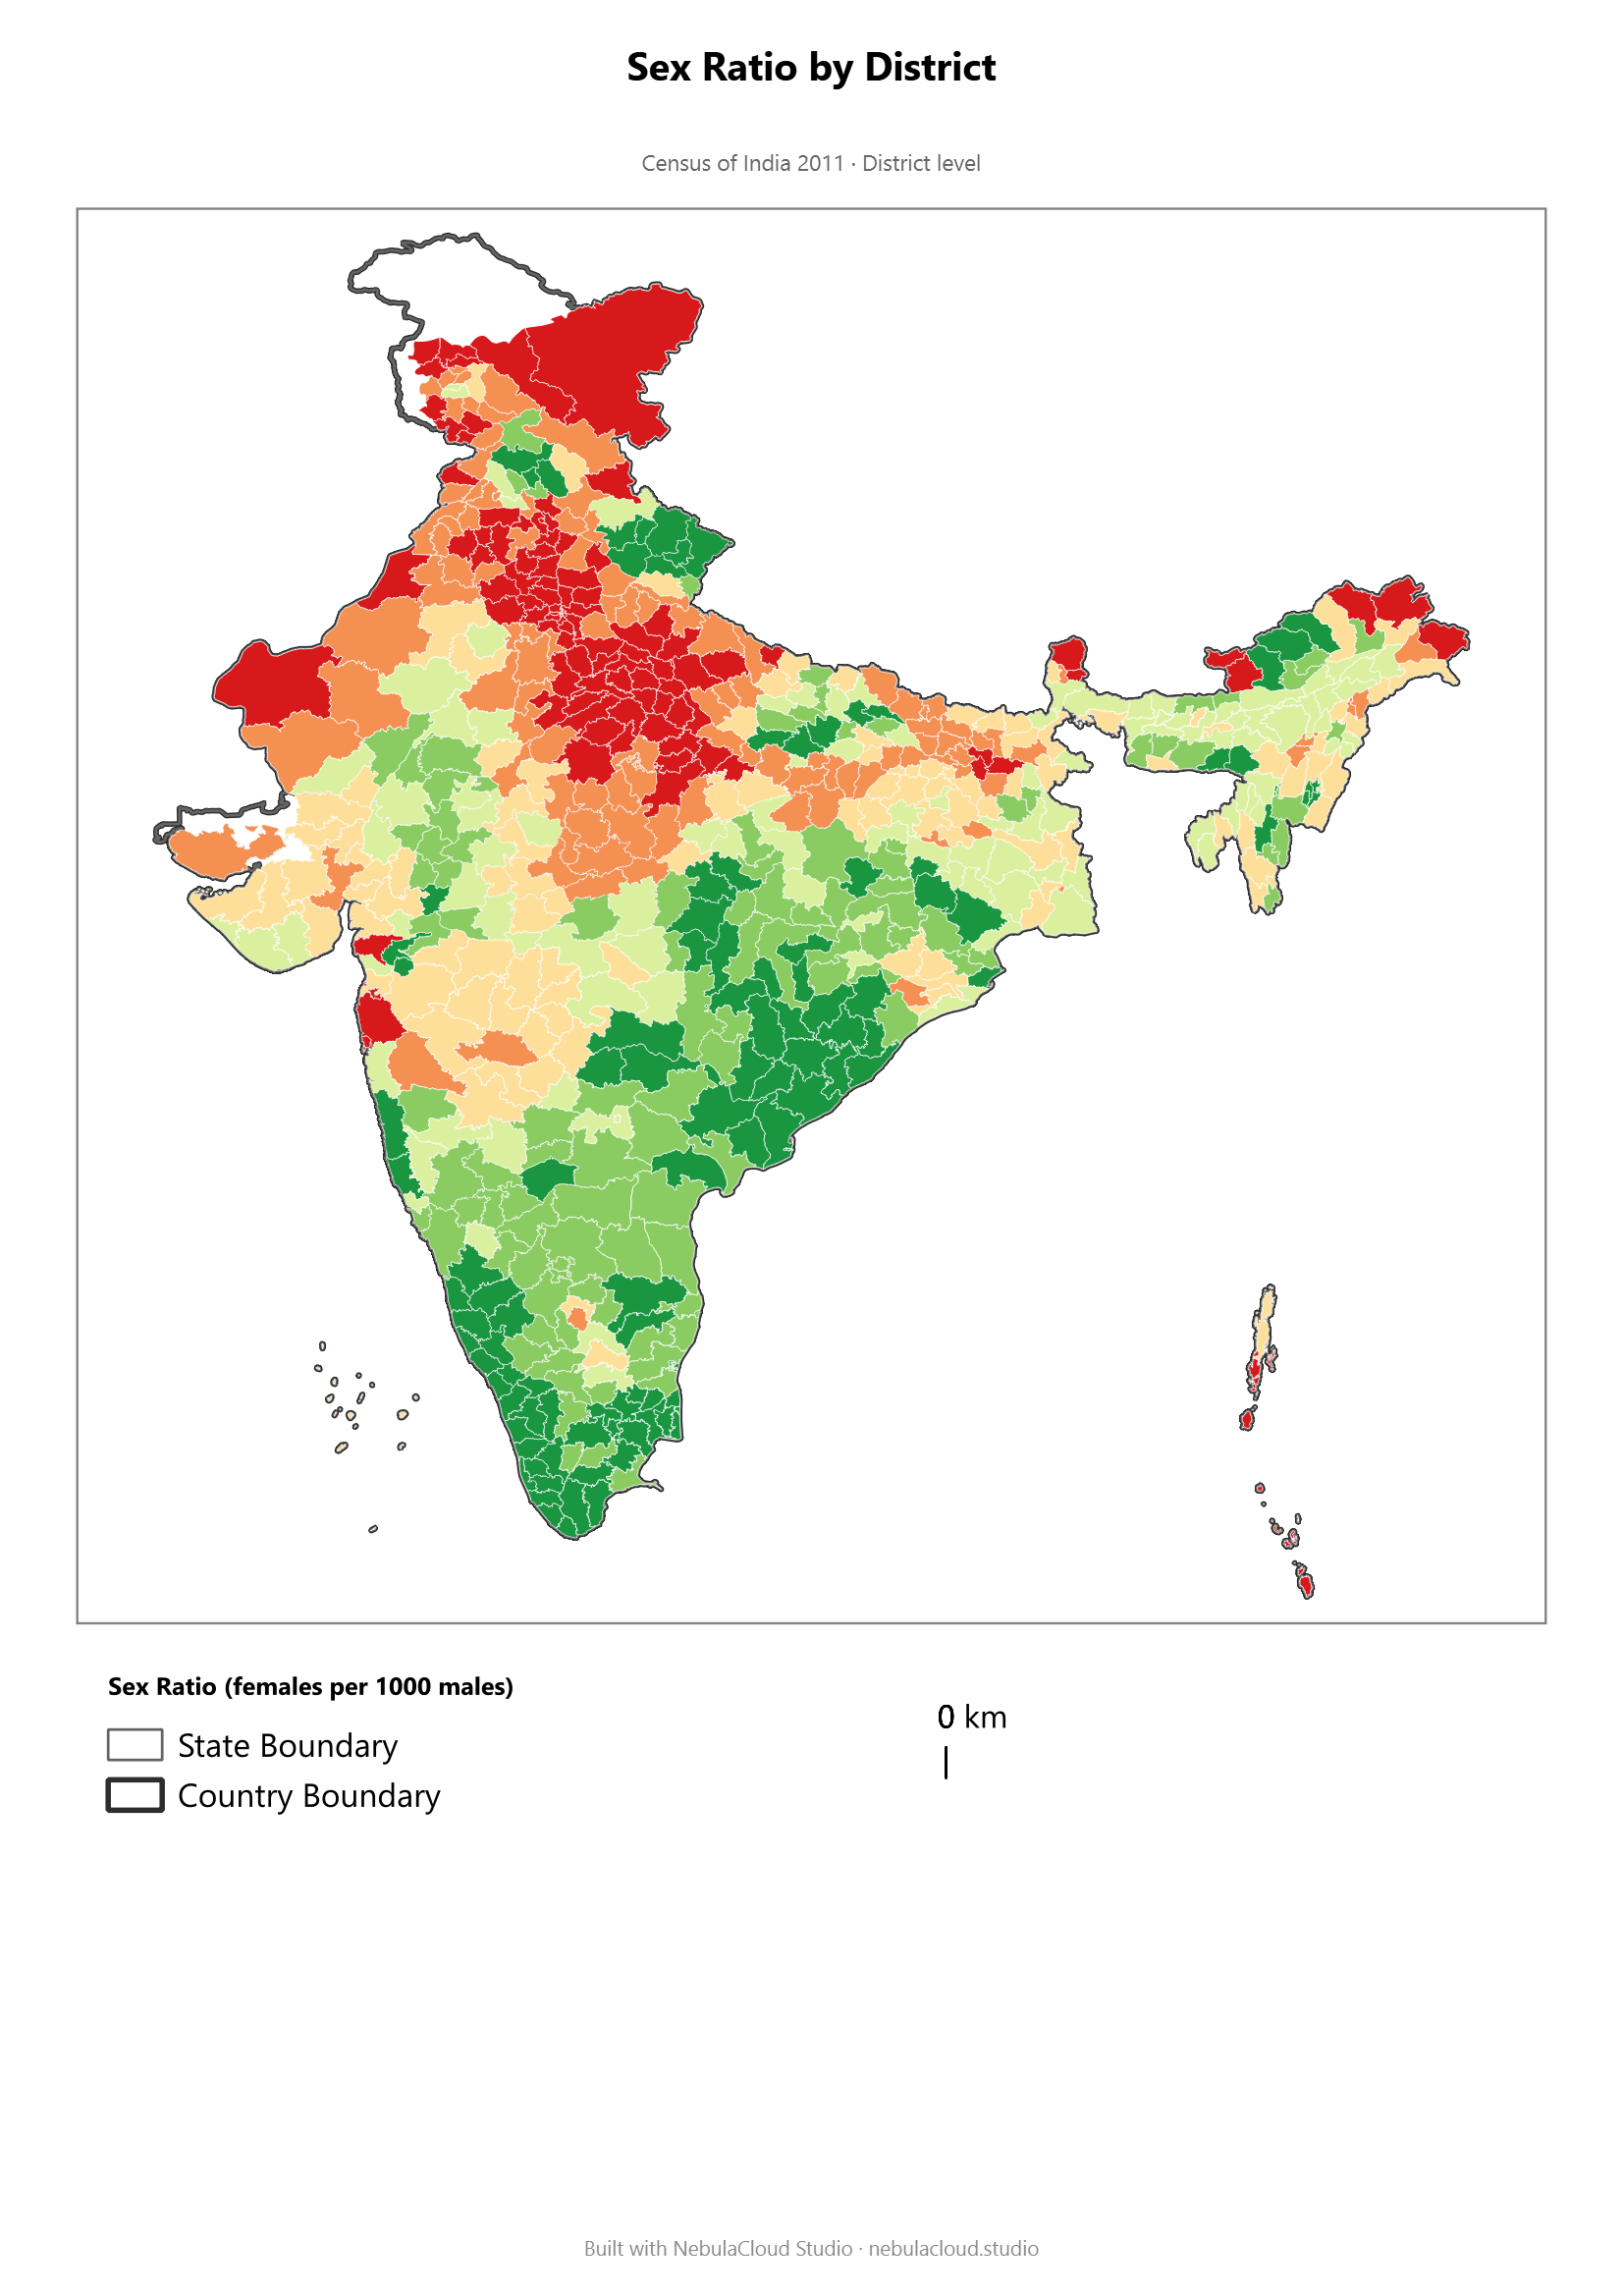
Sex Ratio by District

Sex Ratio

Females per 1,000 males.
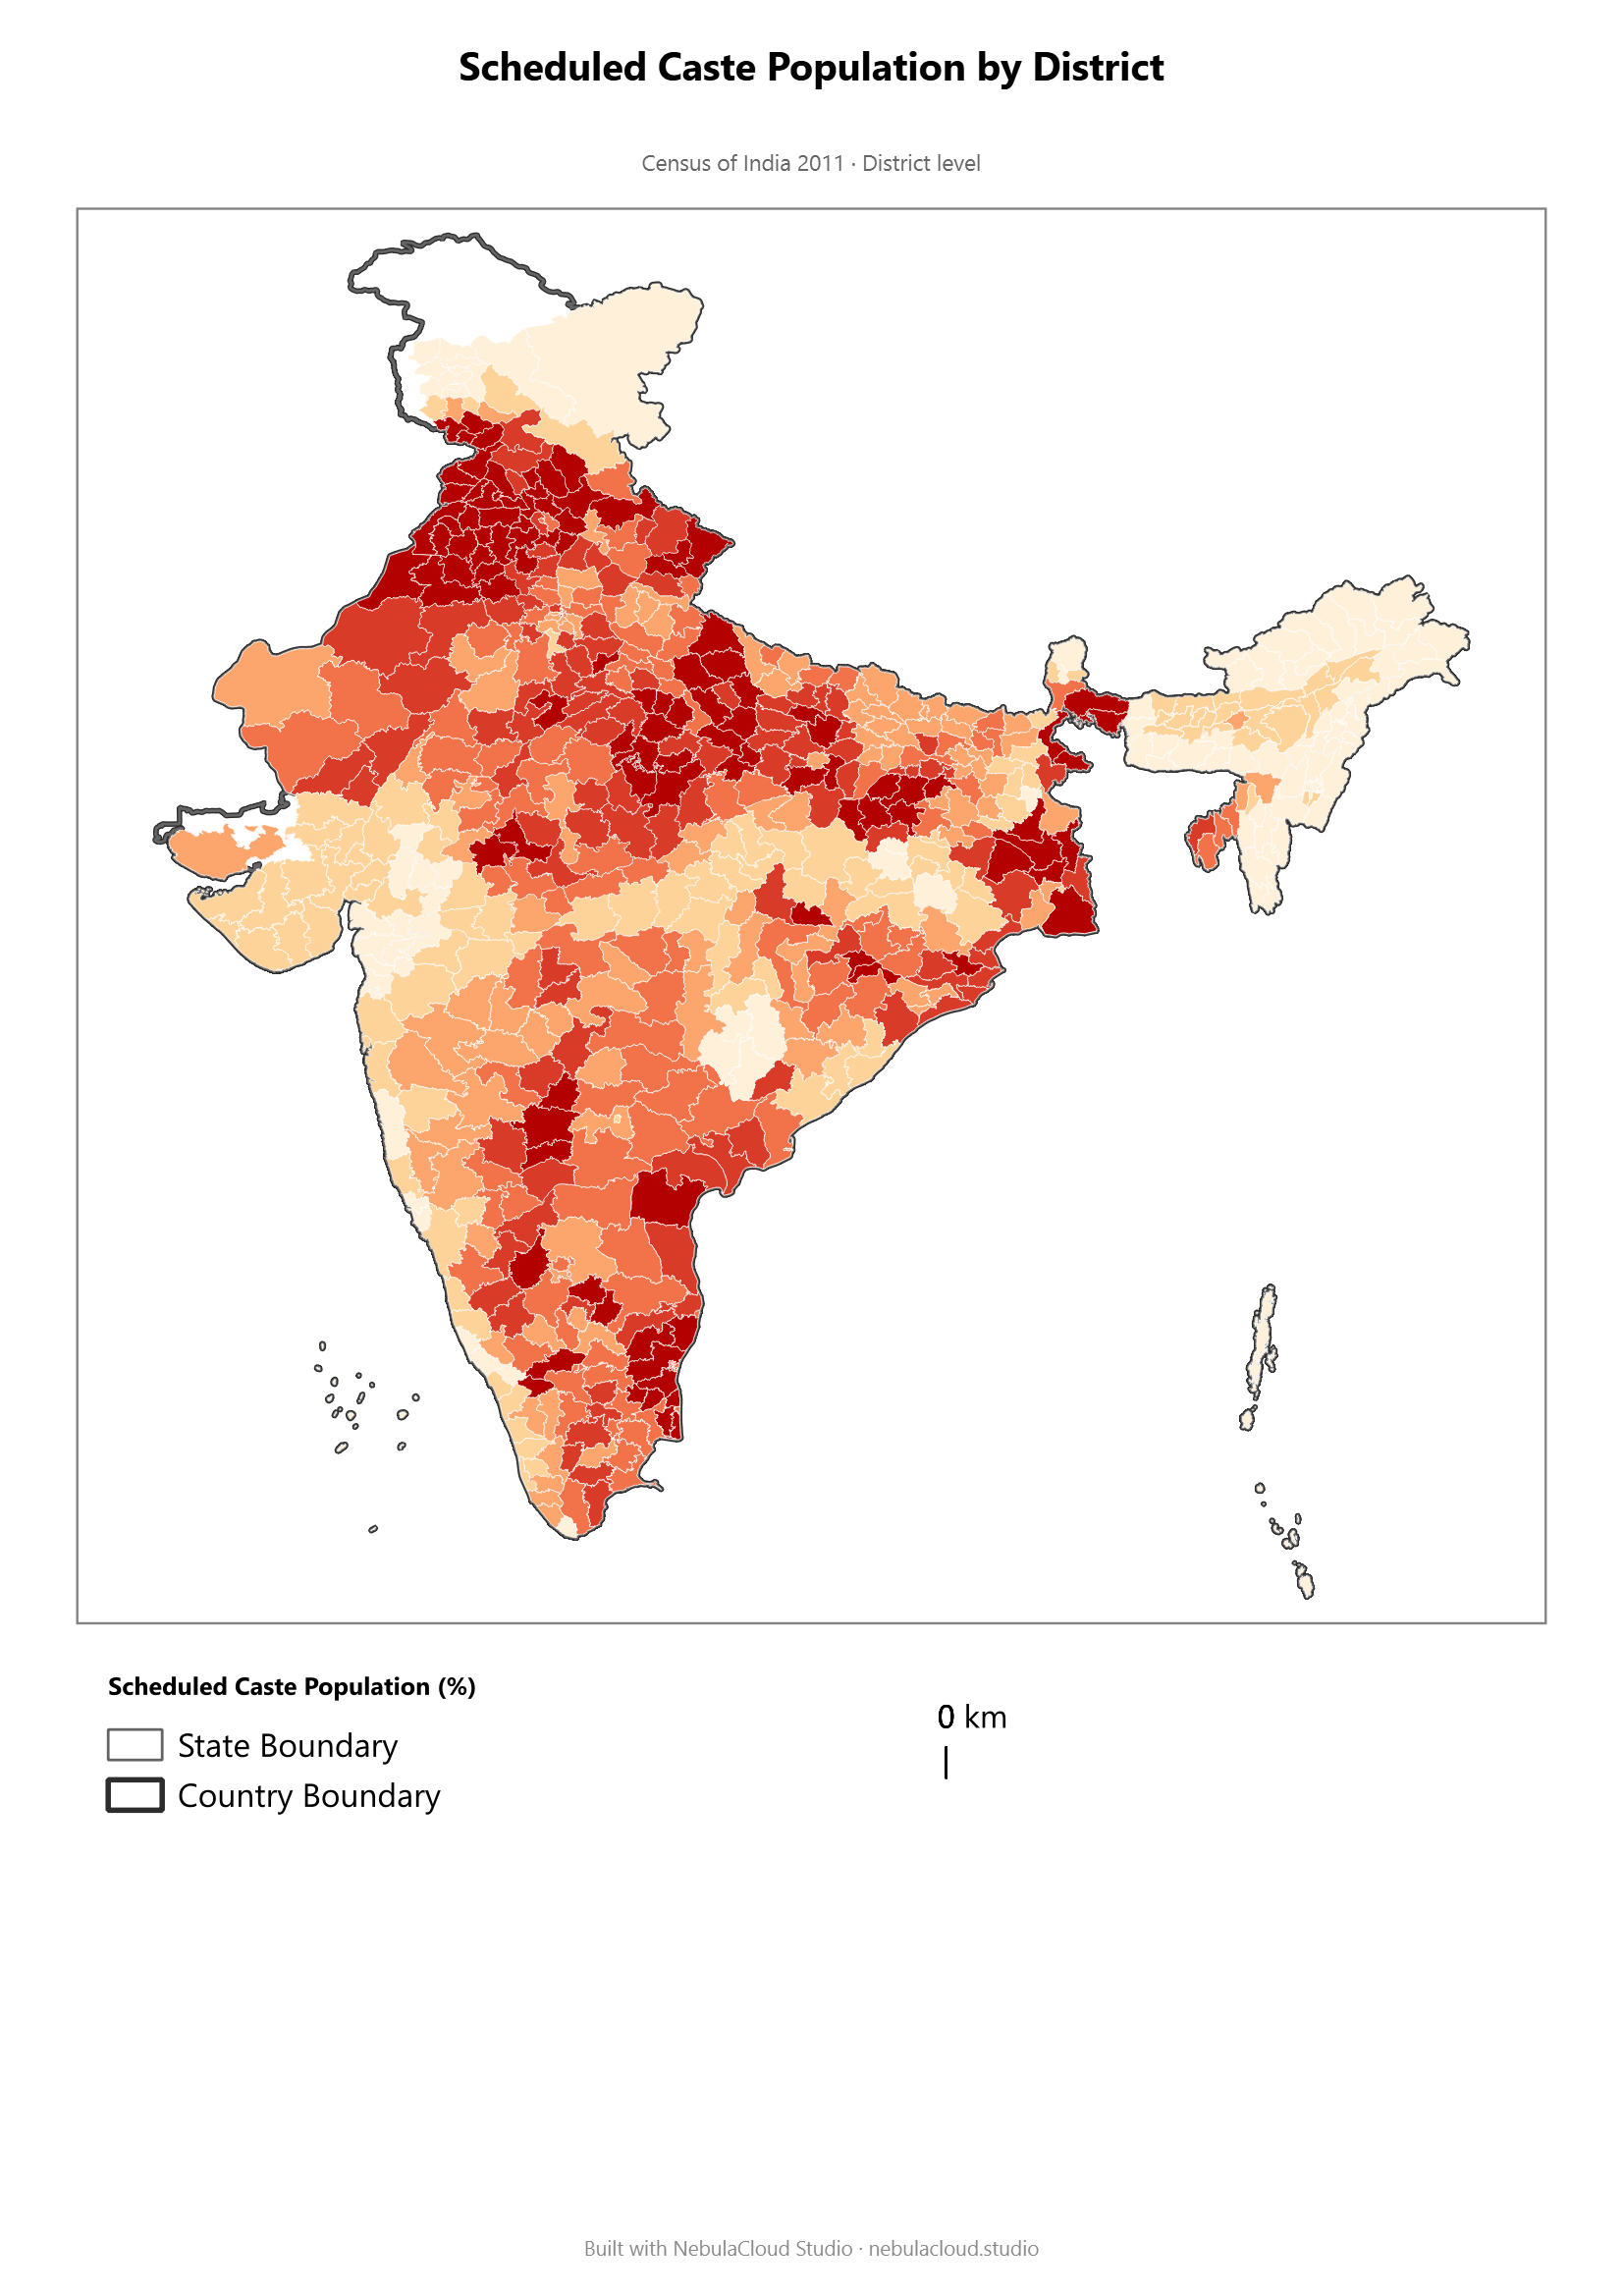
Scheduled Caste Population by District

Scheduled Caste Population

Share of population belonging to Scheduled Castes.
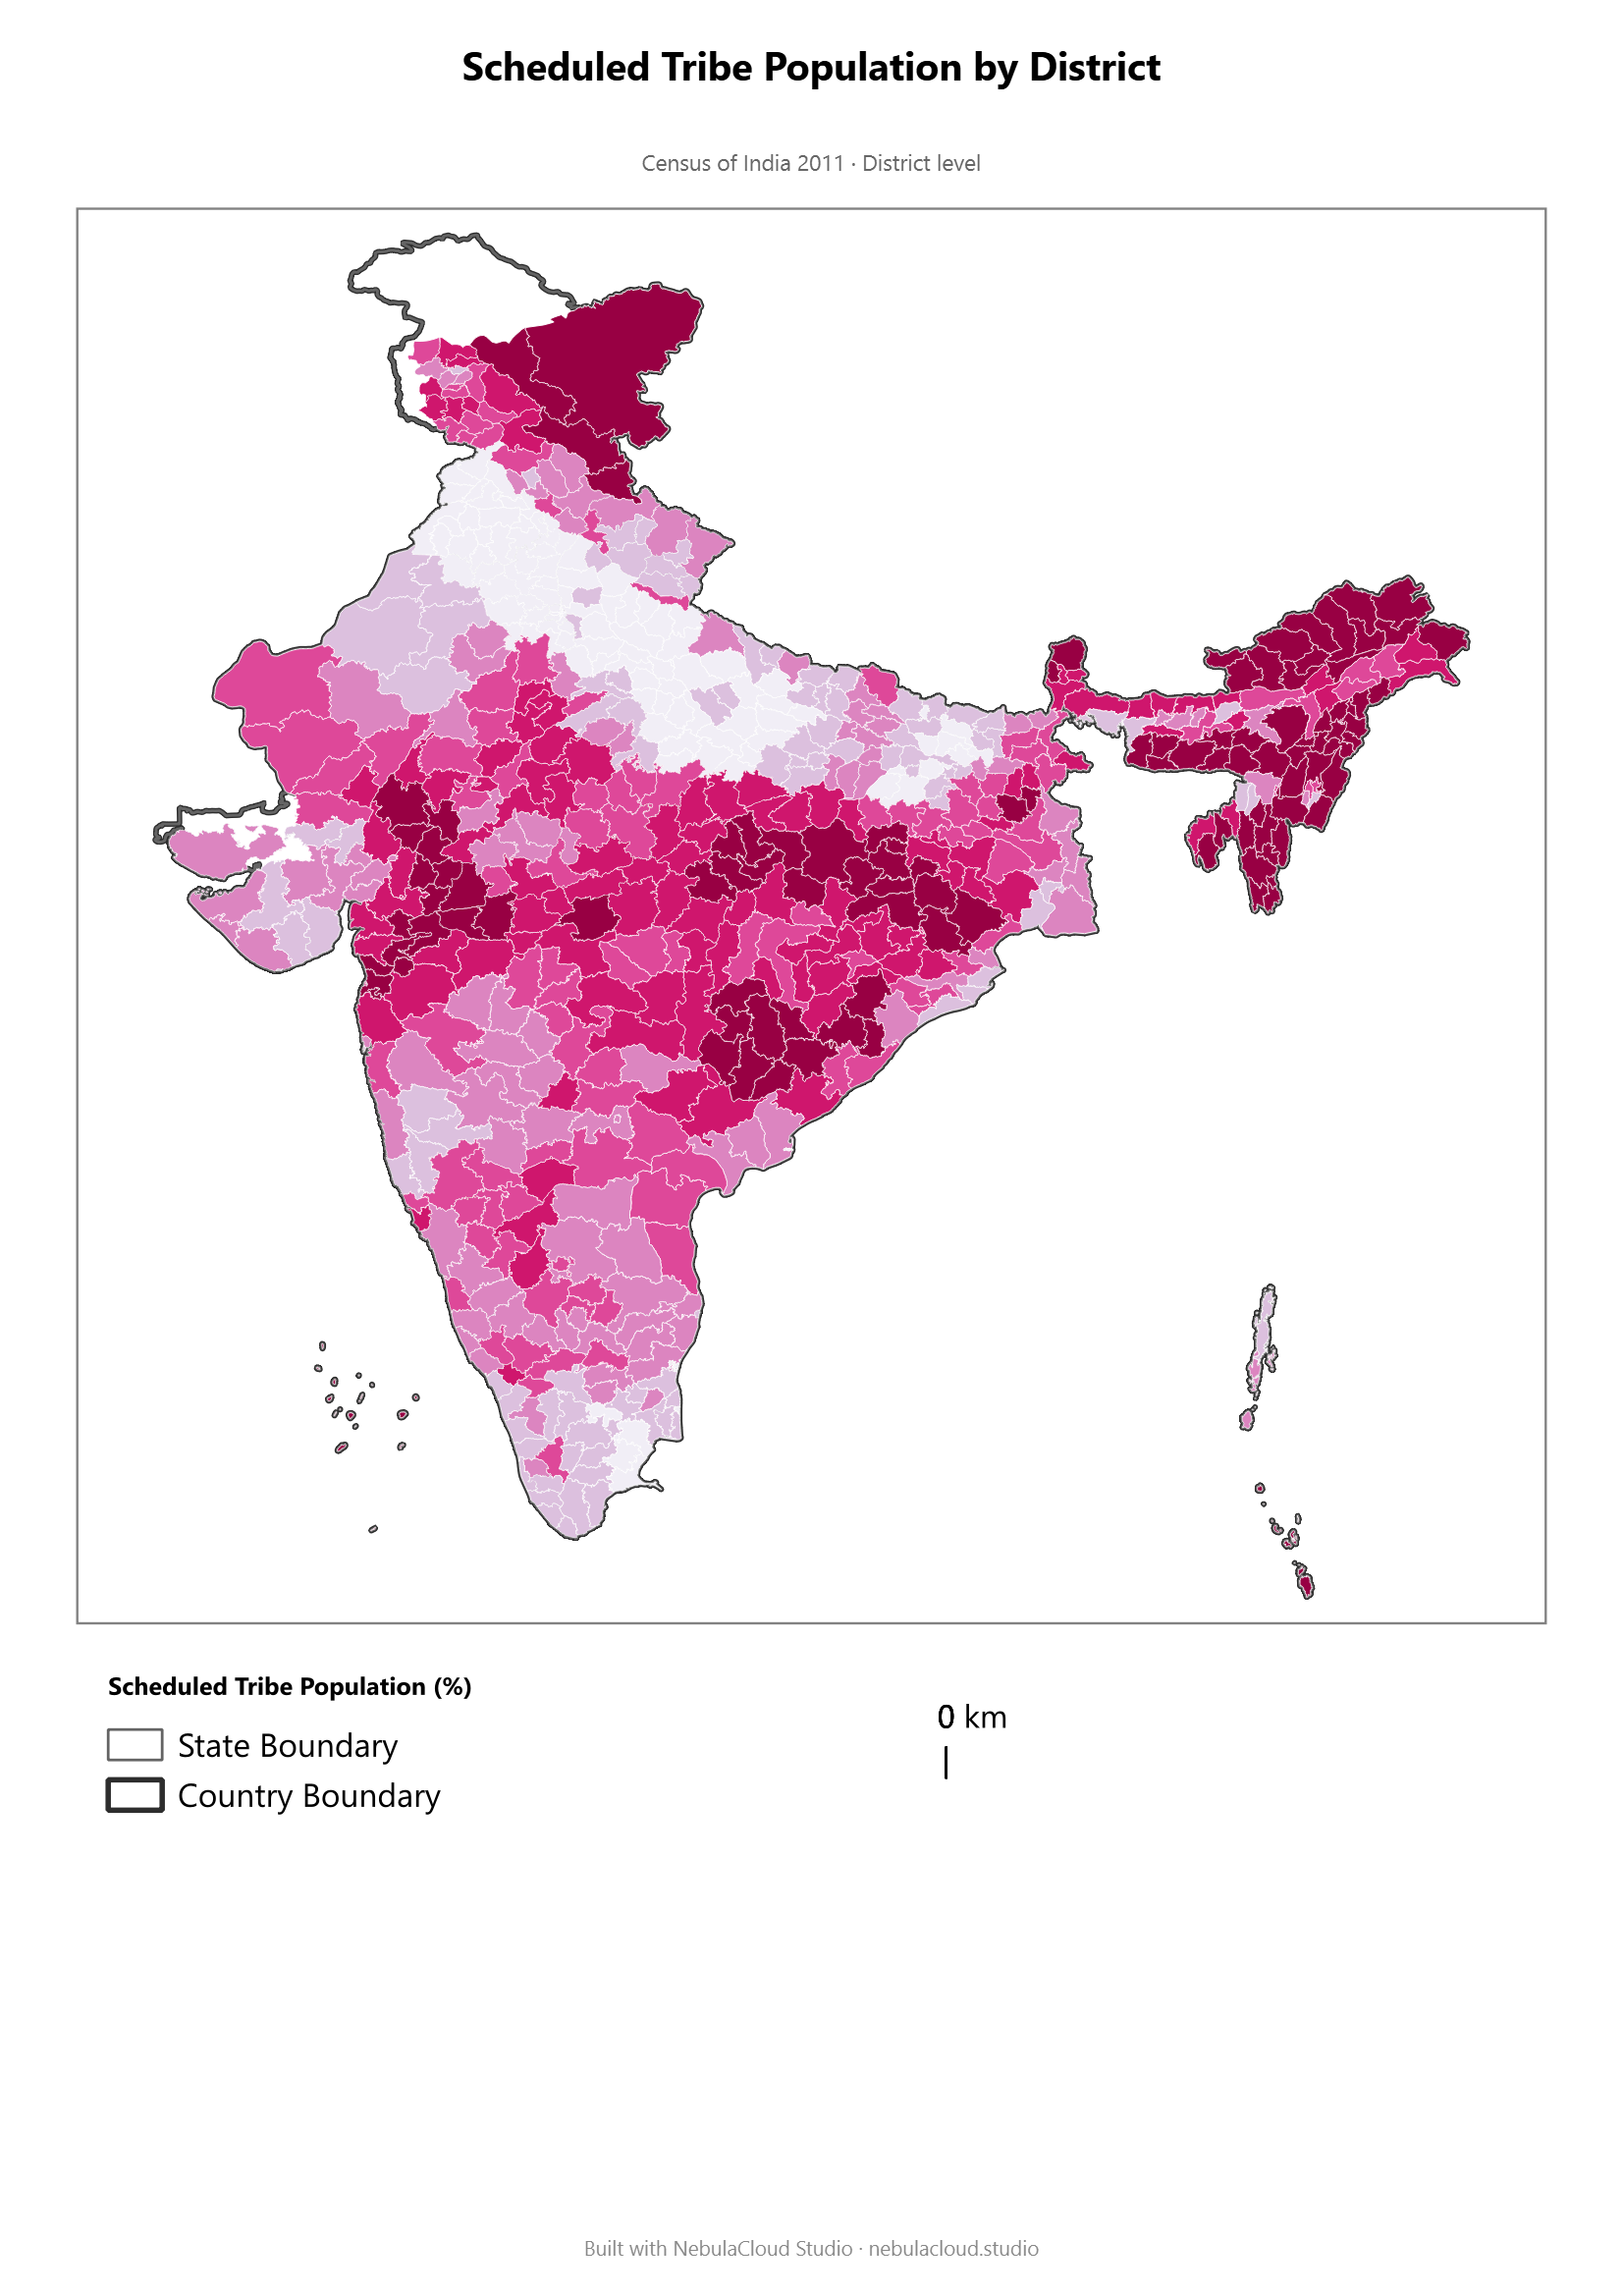
Scheduled Tribe Population by District

Scheduled Tribe Population

Share of population belonging to Scheduled Tribes.
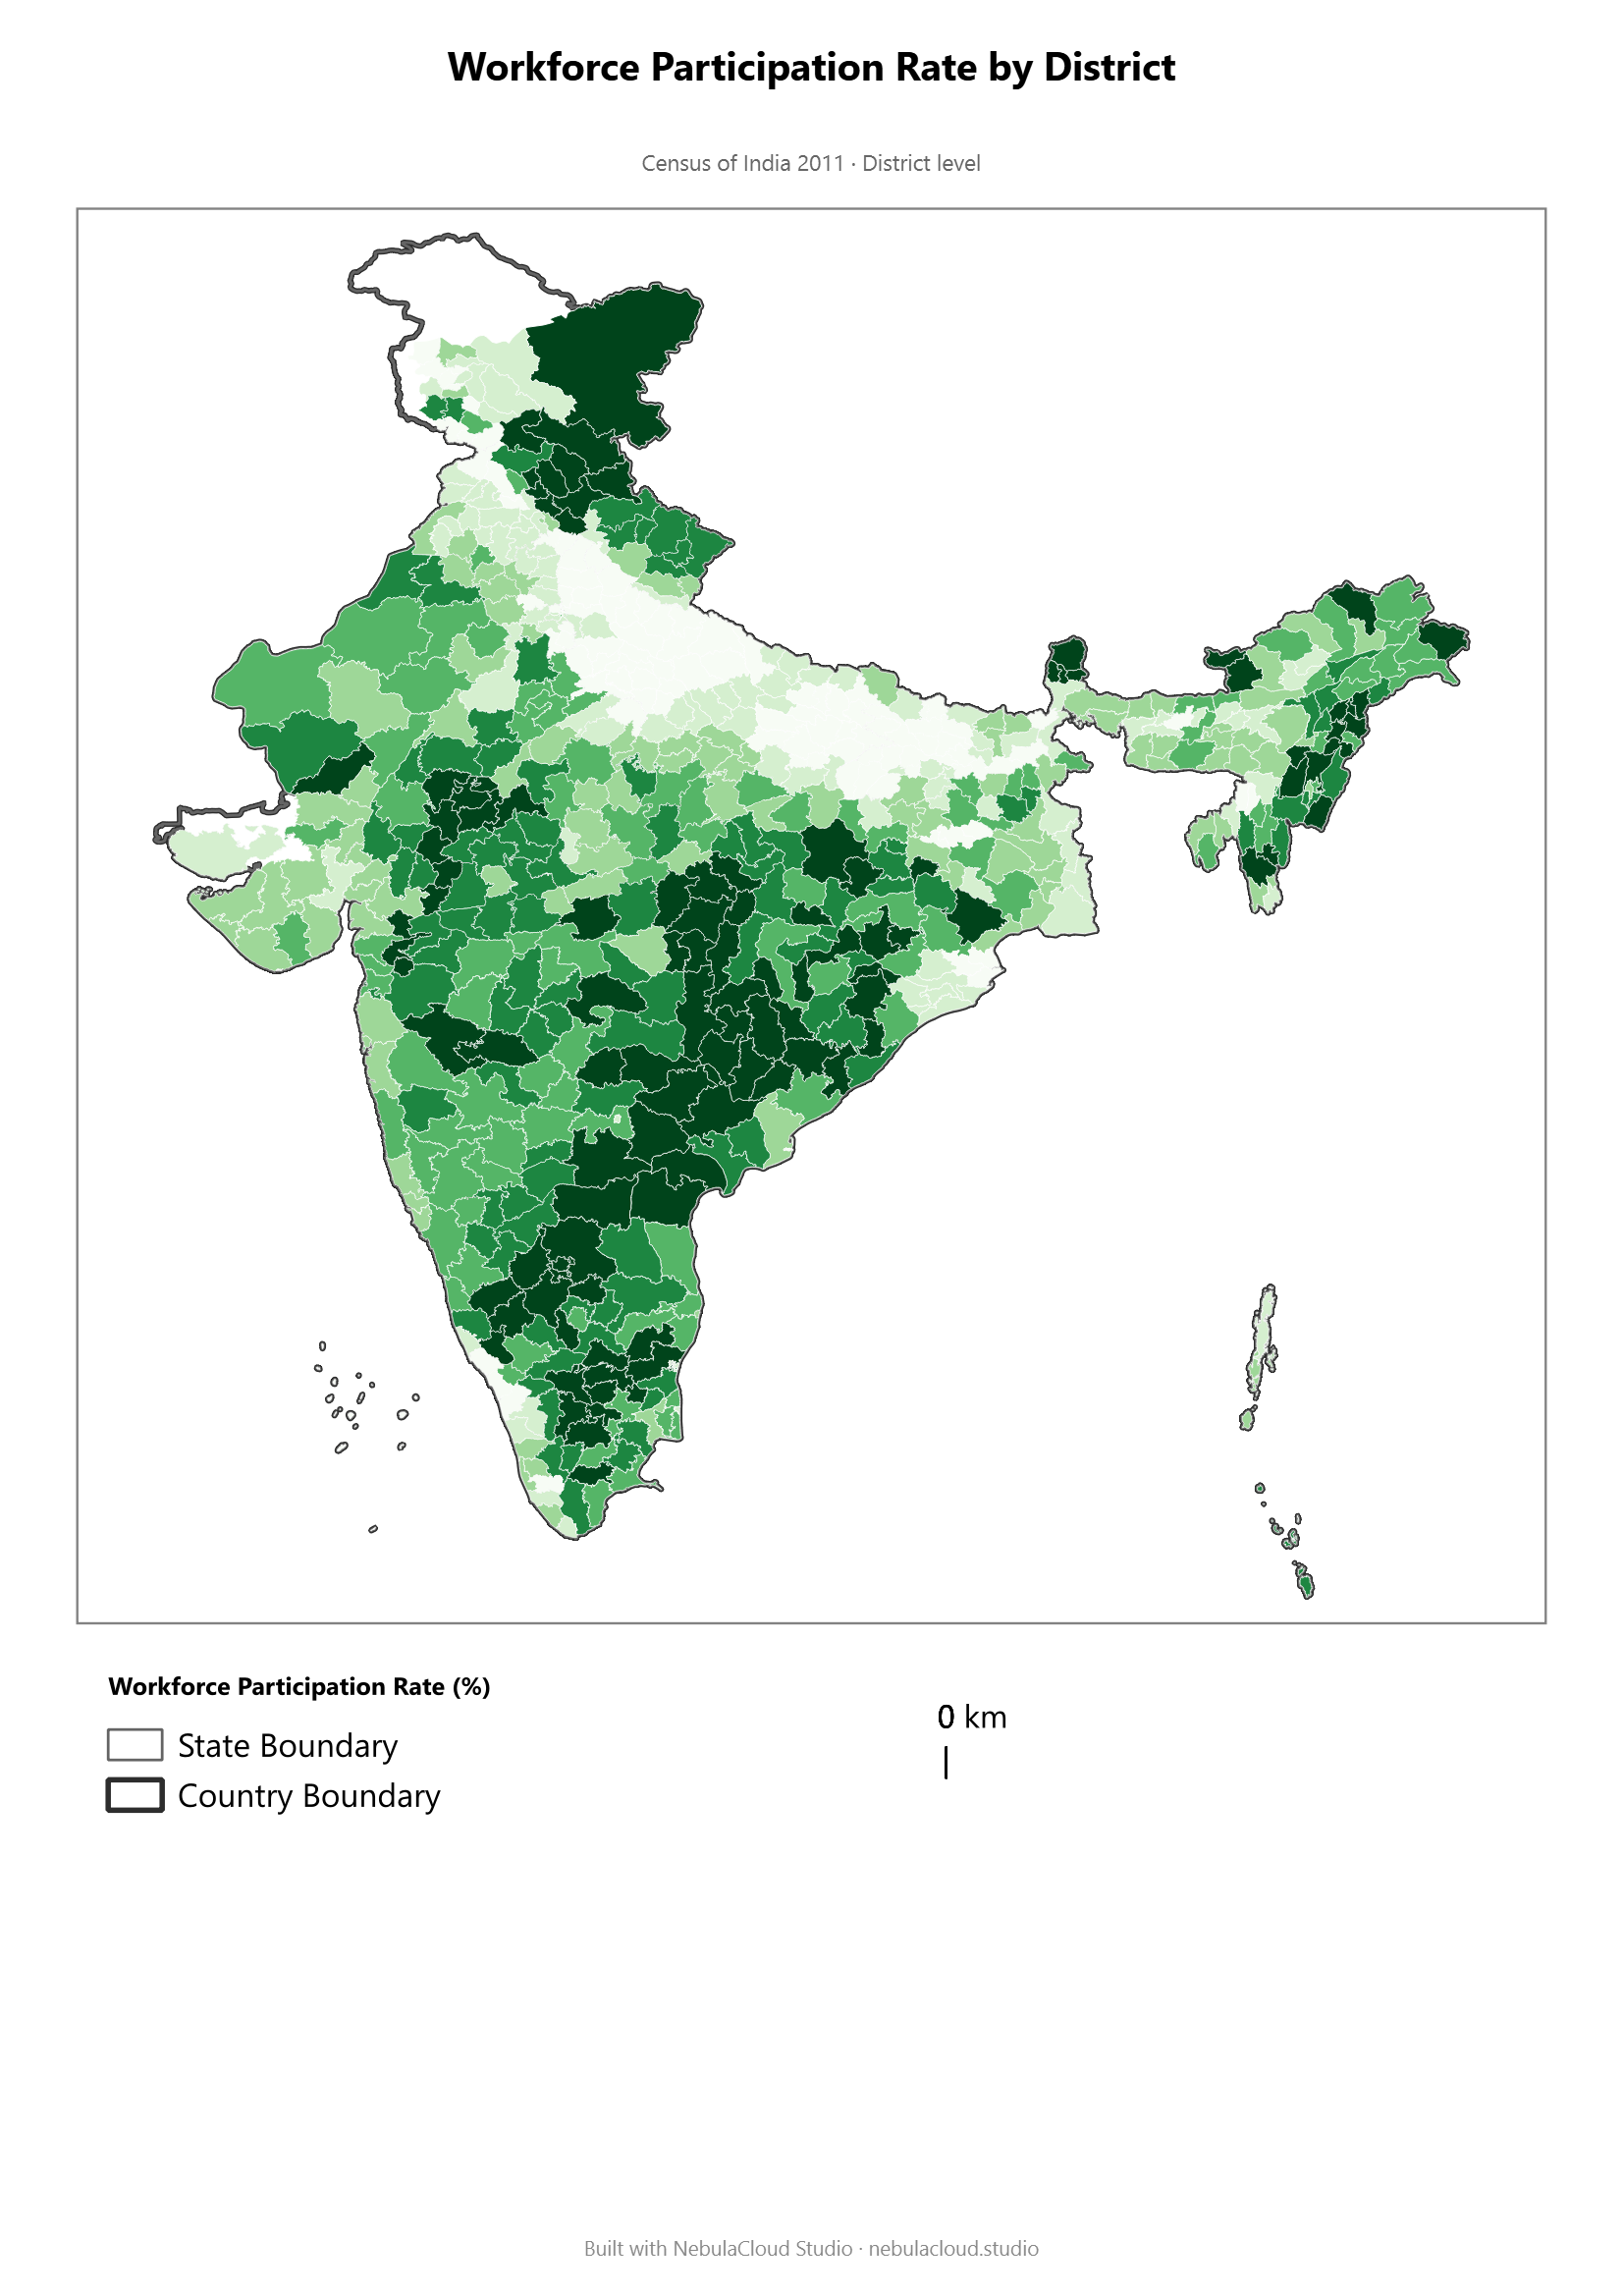
Workforce Participation Rate by District

Workforce Participation Rate

Share of population engaged in work (main + marginal).
Notice: This is a public project showcase created with NebulaCloud Studio. The proprietary source code, implementation details, prompts, workflows, datasets, infrastructure, and deployment configuration are intentionally not included. The maps incorporate Census of India 2011 data — see ATTRIBUTIONS.md.